Public Assistance Recipients Decrease to Lowest Level Since SFY 2009-10
- Family Assistance (FA) provides up to 60 months of cash assistance to eligible needy families; Safety Net Assistance (SNA) provides cash or non-cash assistance to eligible single adults, childless couples, persons who have exceeded the 60-month limit on Family Assistance, children living apart from adult relatives and certain other individuals. “Public assistance” as discussed in this report includes both programs.
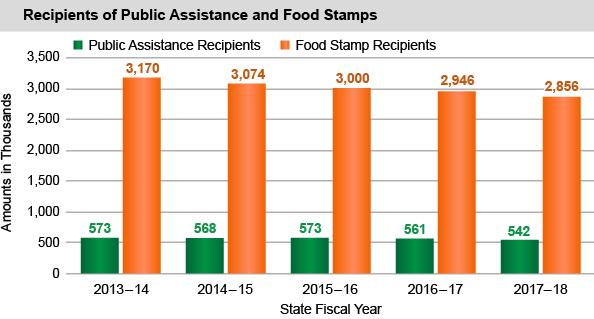
- The average monthly number of public assistance recipients in the State decreased to its lowest level since SFY 2009-10, largely due to fewer FA recipients. The number of public assistance recipients outside of New York City decreased for the third year in a row, after increasing for seven straight years.
- Compared to the prior year, the average monthly number of recipients of public assistance in:
- New York State decreased by 18,597 (3.3 percent) to 541,970;
- New York City decreased by 2,912 (0.8 percent) to 358,649; and
- Areas outside New York City decreased by 15,685 (7.9 percent) to 183,321.
- The number of FA recipients decreased for the fourth year in a row, by 7.7 percent, bringing the cumulative decline over that period to 18.1 percent. SNA recipients decreased for the first time in four years, by less than 1 percent. The number of FA recipients decreased in New York City and in areas outside of New York City, while SNA recipients increased in New York City, but decreased in areas outside of New York City. SNA is largely funded by the State and the counties, while FA is funded by the federal government.
Spending for Public Assistance Increases for the Fifth Time in the Last Six Years
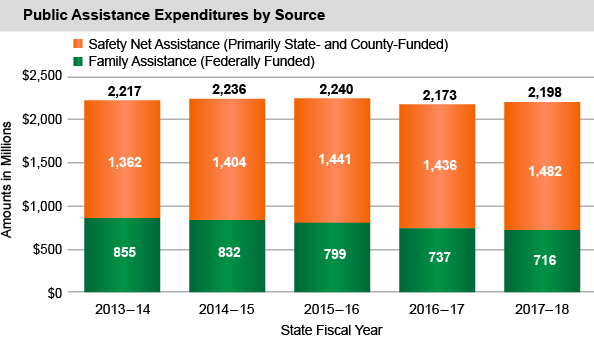
- Public assistance spending increased by 1.2 percent, mainly because of an increase in expenditures in New York City.
- Compared to last year, public assistance expenditures in:
- New York State increased by $25.3 million (1.2 percent) to nearly $2.2 billion;
- New York City increased by $52.5 million (3.7 percent) to over $1.4 billion; and
- Areas outside New York City decreased by $27.2 million (3.5 percent) to $742.2 million.
- FA expenditures decreased while SNA expenditures increased compared to last year. SNA expenditures accounted for 67.4 percent of total public assistance spending.
- Compared to the prior year, SNA expenditures in:
- New York State increased by $46.6 million (3.2 percent) to nearly $1.5 billion;
- New York City increased by $59.5 million (6.0 percent) to more than $1.0 billion; and
- Areas outside New York City decreased by $12.9 million (3.0 percent) to $427.0 million.
- Compared to the prior year, FA expenditures in:
- New York State decreased by $21.3 million (2.9 percent) to $716.1 million;
- New York City decreased by $7.0 million (1.7 percent) to $400.8 million; and
- Areas outside New York City decreased by $14.2 million (4.3 percent) to $315.2 million.
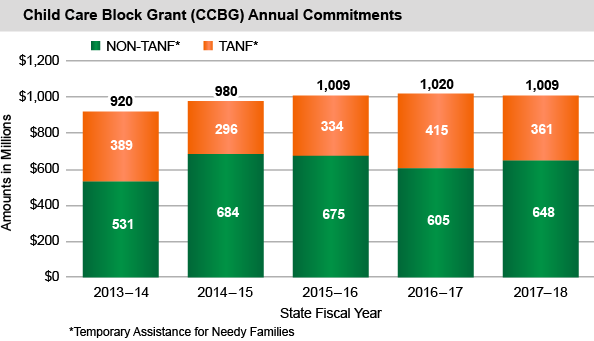
- Child Care Block Grant subsidies for low-income families transitioning from public assistance decreased by $11.0 million (1.1 percent) to just over $1 billion. These subsidies are financed by a combination of federal, State and local sources.
The Number of SNAP Recipients Decreases for Fourth Consecutive Year; Spending Decreases for Fifth Straight Year
- The number of recipients in the State’s Supplemental Nutrition Assistance Program (SNAP) decreased for the fourth consecutive year, following more than a decade of steady growth. SNAP, formerly known as the Food Stamp Program, is funded by the federal government.
- Compared to the prior year, the average monthly number of recipients of SNAP in:
- New York State decreased by 89,580 (3.0 percent) to nearly 2.9 million;
- New York City decreased by 41,112 (2.4 percent) to nearly 1.7 million; and
- Areas outside New York City decreased by 48,468 (3.9 percent) to 1.2 million.
- Expenditures for SNAP decreased for the fifth consecutive year.
- Compared to the prior year, SNAP expenditures in:
- New York State decreased by $228.0 million (4.6 percent) to $4.7 billion;
- New York City decreased by $130.7 million (4.4 percent) to $2.9 billion; and
- Areas outside New York City decreased by $97.3 million (5.1 percent) to $1.8 billion.