The deterioration of capital assets can weaken the State’s economy and its ability to attract and retain business, while a robust, efficiently managed capital investment program can support economic growth. Capital assets include not only highways and bridges, but also facilities for education, government, health and recreation.
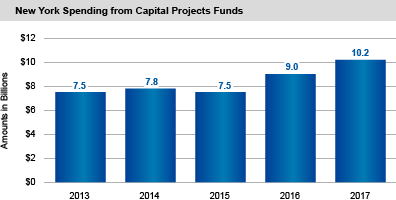
Capital Spending Has Increased Over the Past Five Years
- From 2013 to 2017, capital spending increased by more than $2.6 billion (34.7 percent).
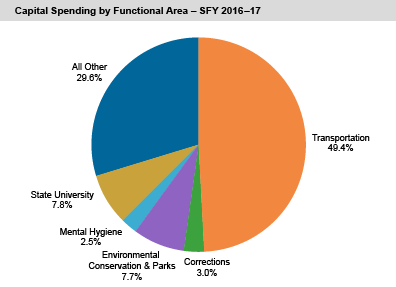
- Capital spending for transportation increased by $1.5 billion (41.7 percent). The increase is primarily attributable to:
- Federally funded projects;
- The Consolidated Highway Improvement Program being shifted to an on-budget accounting structure;
- Mass transportation projects; and
- Projects funded from the Dedicated Infrastructure Investment Fund.
- Capital spending for All Other purposes increased by $1.2 billion (70.1 percent).
- State University capital spending decreased by $446 million (36 percent).
- Capital spending for transportation increased by $1.5 billion (41.7 percent). The increase is primarily attributable to:
- In 2017 and 2016, the State financed 52 percent and 58 percent, respectively, of nonfederal capital spending through current operations on a pay-as-you-go basis, the highest levels since 1994. The State did this in part by utilizing one-time resources (financial settlements) to fund certain capital projects. Between 1995 and 2015, the share financed on a pay-as-you-go basis averaged 39 percent.
- For the next five years, the State projects:
- Capital spending to average $13.8 billion per year; and
- The share of nonfederal capital spending financed on a pay-as-you-go basis to average 36.8 percent.
At the end of SFY 2016-17, the State reported $104.8 billion in capital assets, an increase of $2.3 billion (2.2 percent) over the prior year.