This Google™ translation feature is provided for informational purposes only.
The New York State Office of the State Comptroller's website is provided in English. However, the "Google Translate" option may help you to read it in other languages.
Google Translate™ cannot translate all types of documents, and it may not give you an exact translation all the time. If you rely on information obtained from Google Translate™, you do so at your own risk.
The Office of the State Comptroller does not warrant, promise, assure or guarantee the accuracy of the translations provided. The State of New York, its officers, employees, and/or agents are not liable to you, or to third parties, for damages or losses of any kind arising out of, or in connection with, the use or performance of such information. These include, but are not limited to:
damages or losses caused by reliance upon the accuracy of any such information
damages incurred from the viewing, distributing, or copying of such materials
Because Google Translate™ is intellectual property owned by Google Inc., you must use Google Translate™ in accord with the Google license agreement, which includes potential liability for misuse: Google Terms of Service.
2015 Financial Condition Report For Fiscal Year Ended March 31, 2015
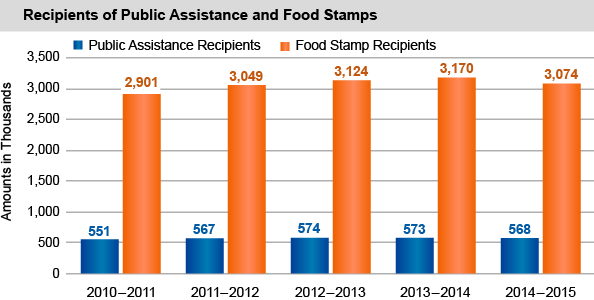
Enrollment in Public Assistance Continues to Decrease In a Recovering Economy
For the second straight year, public assistance enrollment in the State decreased, largely due to lower Family Assistance (FA) enrollment in New York City. This decrease reflects the State’s continued recovery from the economic downturn at the end of the last decade. Enrollment did increase in areas outside of New York City for the seventh consecutive year, but had the smallest increase since SFY 2008-09.
Compared to last year, the average monthly number of recipients of public assistance in:
New York State decreased by 4,627 (0.8 percent) to 568,222;
New York City decreased by 5,106 (1.5 percent) to 338,840; and
areas outside New York City increased by 479 (0.2 percent) to 229,381.
Overall FA enrollment decreased after increasing marginally last year, while overall Safety Net Assistance (SNA) enrollment was slightly higher this year after decreasing for the first time in five years in SFY 2013-14. Areas outside of New York City accounted for nearly all of this increase. SNA is funded by the State and counties while FA is funded by the federal government.
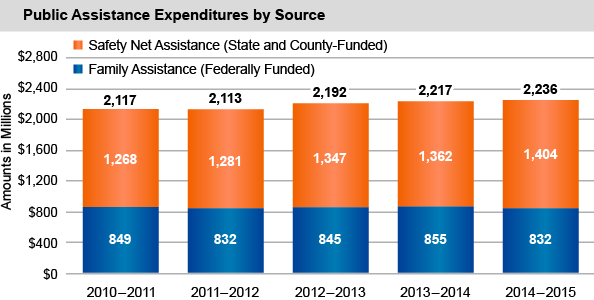
Spending for Public Assistance Continues to Increase But at a Slower Rate
For the third consecutive year, public assistance spending increased, mainly because of an increase in SNA expenditures in areas of the State outside of New York City. This increase continues the program’s recent spending growth, but it is occurring at a slower rate than either of the last two years.
Compared to last year, public assistance expenditures in:
New York State increased by $19.6 million (0.9 percent) to $2.24 billion;
New York City decreased slightly to $1.34 billion; and
areas outside New York City increased by $19.8 million (2.3 percent) to $893.9 million.
SNA expenditures increased while FA expenditures decreased. For New York City, lower FA expenditures more than offset higher SNA expenditures. SNA expenditures accounted for 62.8 percent of total public assistance spending.
Compared to last year, SNA expenditures in:
New York State increased by $42.2 million (3.1 percent) to $1.4 billion;
New York City increased by $19.2 million (2.1 percent) to $914.2 million; and
areas outside New York City increased by $23 million (4.9 percent) to $490.1 million.
Compared to last year, FA expenditures in:
New York State decreased by $22.6 million (2.7 percent) to $831.8 million;
New York City decreased by $19.4 million (4.3 percent) to $428.0 million; and
areas outside New York City decreased by $3.2 million (0.8 percent) to $403.9 million.
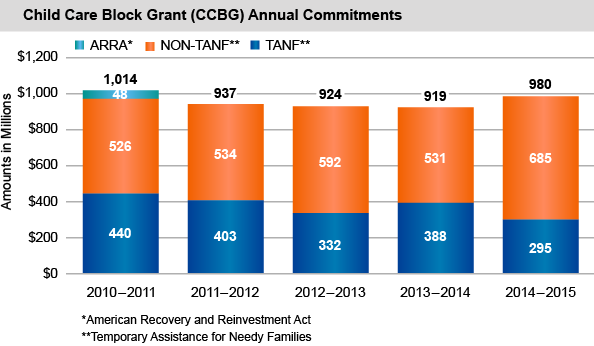
Child Care Block Grant subsidies for low-income families transitioning from public assistance increased by $61 million (6.6 percent) to $980 million. These subsidies are financed by a combination of federal (TANF), State and local sources (Non-TANF).
SNAP Enrollment Decreases for First Time in Over a Decade as Spending Also Decreases
Enrollment in the State’s Supplemental Nutrition Assistance Program (SNAP) decreased for the first time in at least 13 years. SNAP, formerly known as the Food Stamp Program, is funded by the federal government.
Compared to last year, the average monthly number of recipients of SNAP in:
New York State decreased by 96,865 (3.1 percent) to 3.1 million;
New York City decreased by 108,638 (5.9 percent) to 1.74 million; and
areas outside New York City increased by 11,773 (0.9 percent) to 1.33 million.
Expenditures for SNAP decreased for the second consecutive year.
Compared to last year, SNAP expenditures in:
New York State decreased by $389.7 million (7.1 percent) to $5.1 billion;
New York City decreased by $338.9 million (10 percent) to $3 billion; and
areas outside New York City decreased by $50.8 million (2.4 percent) to $2.08 billion.